Equation X-Ray · Read the structure, then explain it
Mathematics as a language
Read a prediction before adjusting it
Estimate a house price from area without confusing the estimate with its observed sale price.
ŷ = wx + b
Read the relationship before trying to solve it. This is an illustrative example, separate from the live experiment.
Choose a building block to inspect its role.
Read the operations: At x=2.5, multiply 42 × 2.5 = 105, then add 140 to get 245.
Build the expression from smaller operations
Choose a valid construction in the stated order. This exercise organizes dependencies; it does not claim every implementation must evaluate independent branches in this order.
What problem could this relationship represent?
A rate plus a baseline also describes many non-housing relationships.
Context we still need: A model relationship does not prove that changing area causes a price change in the world.
Connect the operations to code
prediction = coefficient * area + baselineRead the code as a map of operations. It is not executed here; imports, shapes and numerical safeguards depend on the actual lesson.
Explain a changed situation
Review the five-level equation-reading journey →
Your notes and reveals are temporary. This reading practice does not change lesson completion or saved assessment evidence.
Measuring how wrong we are
1 · Observe
A miss is not just a number
| Word | What it means |
|---|---|
| Residual | Actual value minus the prediction. Positive means the model guessed too low. |
| MAE | Mean absolute error: average of the misses ignoring sign. Treats every miss the same. |
| MSE | Mean squared error: average of squared misses. Punishes big misses extra. |
| RMSE | Root of the MSE. Same unit as the target, but still punishes big misses. |
| Outlier | A case far from the others, such as one flat that sold for far more than expected. |
Two models can both be 'wrong by about 3 lakh' and be wrong in very different ways. One misses every flat by a little. The other is nearly exact except for a flat that is off by 25. Which error measure you choose decides which model you prefer.
2 · Express
Residuals and three summaries
A residual is actual minus predicted. Summarise the residuals in one of three ways.
3 · Visualize
Five flats, then a wild one
Actual prices 50, 60, 70, 80, 90 lakh against predictions 52, 57, 74, 78, 91. The residuals are −2, +3, −4, +2, −1.
| Measure | Five flats | After adding one flat that sold 108 lakh above its prediction |
|---|---|---|
| MAE | 2.40 | 20.00 |
| MSE | 6.80 | – |
| RMSE | 2.61 | 44.16 |
One extra flat, six in all, lifts MAE from 2.4 to 20.0, and RMSE from 2.61 to 44.16. That single flat produces 99.7 percent of the total squared error, so MSE and RMSE are dominated by it.
- MAE
- RMSE
See the numbers behind this picture
| Scenario (0 = five flats, 1 = plus one wild flat) | MAE | RMSE |
|---|---|---|
| Five flats | 2.4 | 2.61 |
| Plus one wild flat | 20 | 44.16 |
4 · Discover
Choose the measure to match the cost
If a miss of 20 is twice as bad as a miss of 10, MAE matches your costs. If a miss of 20 is much worse than twice a miss of 10, for example a mispriced flat that loses a deal, squared error matches better. State which you use, and report the measure you trained on and the one the business cares about.
5 · Apply
Two worked examples
Example 1, by hand. Residuals −2, 3, −4, 2, −1. Absolute: 2, 3, 4, 2, 1, total 12, MAE = 12 ÷ 5 = 2.4. Squares: 4, 9, 16, 4, 1 = 34, MSE = 6.8, RMSE = √6.8 = 2.61.
Example 2, the wild flat. Residual 108: its square is 11,664, against 34 for the other five together. Check whether it is a data error before you let it steer the fit.
6 · Where it goes wrong
Three ways it goes wrong
7 · In Python
MAE, MSE and RMSE in code
Here is how to implement it, step by step. The code below does exactly these steps, and every line is editable.
- Compute each residual: actual price minus predicted price.
- MAE: take the absolute value of each residual and average.
- MSE: square each residual and average.
- RMSE: take the square root of the MSE, so it is back in lakh.
- Add one extreme flat and recompute, to see which measure reacts most.
import numpy as np

y = np.array([50.0, 60.0, 70.0, 80.0, 90.0])
pred = np.array([52.0, 57.0, 74.0, 78.0, 91.0])
res = y - pred
print("residuals y - prediction:", res)
print("MAE  =", np.abs(res).mean())
print("MSE  =", (res ** 2).mean())
print("RMSE =", round(float(np.sqrt((res ** 2).mean())), 3))

# one wild sale
y2, pred2 = np.append(y, 200.0), np.append(pred, 92.0)
res2 = y2 - pred2
print("after adding one flat that sold 108 lakh above the prediction:")
print("MAE  =", round(float(np.abs(res2).mean()), 2), "| RMSE =", round(float(np.sqrt((res2 ** 2).mean())), 2))
print("share of squared error from that single flat:", round(float(res2[-1] ** 2 / (res2 ** 2).sum()), 3))
residuals y - prediction: [-2. 3. -4. 2. -1.]
MAE = 2.4
MSE = 6.8
RMSE = 2.608
after adding one flat that sold 108 lakh above the prediction:
MAE = 20.0 | RMSE = 44.16
share of squared error from that single flat: 0.997Edit and run this code in your browser
Live Python
Residuals, three error measures and one wild flat
Runs in your browser on your device. Nothing you type is sent anywhere, and nothing here changes your saved progress.
Press Ctrl+Enter (⌘+Enter on Mac) to run. Tab moves focus to the next control, as usual; use spaces to indent.
Want to implement it? Open the step-by-step playbook · How to choose a model
The big idea
Which house does the line get most wrong?
A line is only useful if we can say how well it fits. “Pretty good” will not do when a bank prices a mortgage from it. We need a single number, and the choice of that number decides which mistakes the model fears most.
Predict before you read on
Spot the biggest miss
With w = 42, b = 140 the estimates are 182, 215.6, 245, 274.4, 308 and 341.6 for recorded prices 178, 213, 246, 278, 316 and 349. Which house has the largest miss?
Learning objectives
Read an error before reducing it to one score.
- Calculate and interpret signed residuals.
- Compare MAE, MSE, and RMSE—including outlier sensitivity and units.
- Choose evaluation evidence that matches the real decision.
Actual, prediction, residual
Direction matters before aggregation.
An actual value is observed. A prediction is the model estimate. This course defines residual = prediction − actual: negative means underprediction and positive means overprediction.
Three summaries, three meanings
The transformation determines what the metric emphasizes.
MAE
Average of |residual|
MSE
Average of residual²
RMSE
√MSE
Squaring turns a residual of 10 into 100, but a residual of 20 into 400. Doubling the miss quadruples its squared contribution.
Review metric names and formulas
Interactive experiment
How should we summarize all the ways a prediction line can miss?
Predict before experimenting
If one home has an extreme target, which metric will react most strongly?
- MAE
- 4.43 average absolute miss
- MSE
- 25.91 average squared miss
- RMSE
- 5.09 square root of MSE
- Observation 3
- -1 signed residual (₹ lakh)
Accessible calculation table
Inspect what each observation contributes.
| Observation | Actual | Prediction | Residual | Absolute | Squared |
|---|---|---|---|---|---|
| 1 | 178 | 182 | 4 | 4 | 16 |
| 2 | 213 | 215.6 | 2.6 | 2.6 | 6.76 |
| 3 | 246 | 245 | -1 | 1 | 1 |
| 4 | 278 | 274.4 | -3.6 | 3.6 | 12.96 |
| 5 | 316 | 308 | -8 | 8 | 64 |
| 6 | 349 | 341.6 | -7.4 | 7.4 | 54.76 |
Outliers change the question.
Baseline MAE is 4.43 and RMSE is 5.09. After revealing the extreme target, compare both cards. MAE describes a typical absolute miss; RMSE is more sensitive when large misses deserve disproportionate attention.
Lesson summary
0 of 4 checks complete
Residuals preserve direction. MAE summarizes proportional distance. MSE and RMSE emphasize large misses. Metric choice is a modeling decision, and training error alone cannot establish generalization.
Pass all four checks and run the outlier experiment to complete this lesson.Now you drive
Compute the error scores yourself
Three scores summarise the same residuals. They differ in how they treat a big miss: MAE counts it once, MSE and RMSE square it, so one large miss is punished far more.
| Maths | Python | In plain words |
|---|---|---|
| rᵢ = ŷᵢ − yᵢ | [p - y for p, y in zip(predictions, prices)] | One residual per house. |
| MAE = (1/m) Σ |rᵢ| | sum(abs(r) for r in residuals) / len(residuals) | Average size of the misses. |
| MSE = (1/m) Σ rᵢ² | sum(r ** 2 for r in residuals) / len(residuals) | Average squared miss. |
| RMSE = √MSE | math.sqrt(mse) | Back in rupees again. |
Live Python
MAE, MSE and RMSE from scratch
Runs in your browser on your device. Nothing you type is sent anywhere, and nothing here changes your saved progress.
Press Ctrl+Enter (⌘+Enter on Mac) to run. Tab moves focus to the next control, as usual; use spaces to indent.
Stuck? Show a worked solution (try first!)
import math

w, b = 42.0, 140.0
areas  = [1.0, 1.8, 2.5, 3.2, 4.0, 4.8]
prices = [178, 213, 246, 278, 316, 349]

predictions = [w * a + b for a in areas]

residuals = [p - y for p, y in zip(predictions, prices)]

mae  = sum(abs(r) for r in residuals) / len(residuals)
mse  = sum(r ** 2 for r in residuals) / len(residuals)
rmse = math.sqrt(mse)

print("residuals:", [round(r, 2) for r in residuals])
print(f"MAE  = {mae:.4f}")
print(f"MSE  = {mse:.4f}")
print(f"RMSE = {rmse:.4f}")
Experiment, then explain
Finish the TODOs, then try the quick experiments. Think about each question before opening its answer.
The residuals are +4, +2.6, −1, −3.6, −8, −7.4. Why can’t we just average them?
They sum to −13.4 / 6 ≈ −2.23, which looks small only because positive and negative misses cancel. A model that is wrong by +100 and −100 would score a perfect 0. Taking abs() or squaring first removes the sign.
MAE is 4.43 but RMSE is 5.09. Why is RMSE bigger?
Squaring makes big misses count extra, and the square root only partly undoes it. RMSE ≥ MAE always, and the gap grows when a few errors dominate. Try the “very wrong line” experiment and compare the two.
Same numbers, two ways: these scores are the ones the guided lab above reports, produced by the platform’s verified TypeScript maths runtime.
Explore the book’s separate housing example
Make every miss count without cancelling
A line predicts 30 for an observation recorded as 35. Its residual is +5. Another residual could be negative; adding signed misses could hide both.
The playground uses a separate dataset. Compare with the illustrated example ↓
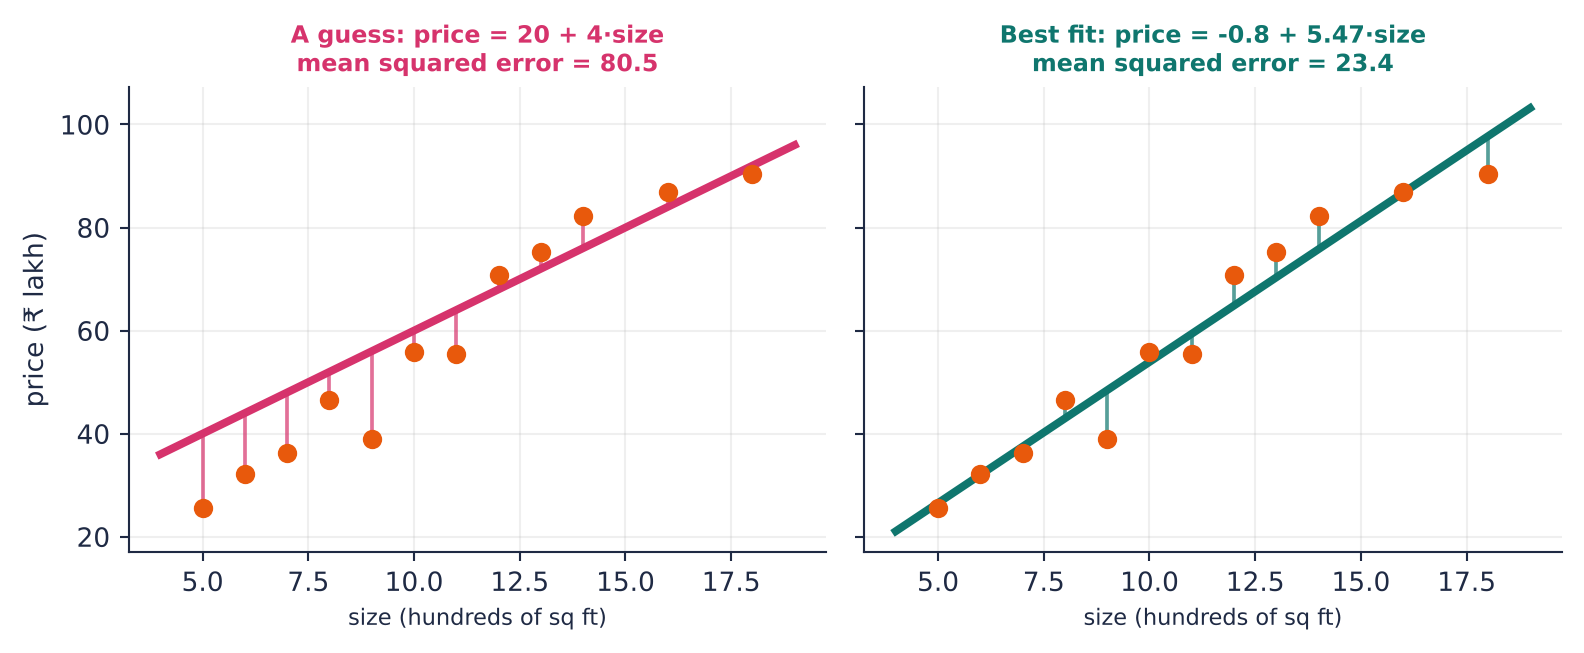
Source: Linear Regression · Book 8, PDF pages 6–7. Static source illustration; annotated scores belong to this example.
| Residual | Squared miss |
|---|---|
| −2 | 4 |
| 1 | 1 |
| 4 | 16 |
| Mean of squares | 7 |
residual = y − ŷ; MSE = mean(residual²); RMSE = √MSE
y means recorded target and ŷ the prediction. MSE emphasizes large misses; RMSE returns to the target’s units. MAE averages absolute misses.
Return to the playground and explain how its inputs connect to this relationship. Unscored reading.