Equation X-Ray · Read the structure, then explain it
Mathematics as a language
Read a prediction before adjusting it
Estimate a house price from area without confusing the estimate with its observed sale price.
ŷ = wx + b
Read the relationship before trying to solve it. This is an illustrative example, separate from the live experiment.
Choose a building block to inspect its role.
Read the operations: At x=2.5, multiply 42 × 2.5 = 105, then add 140 to get 245.
Build the expression from smaller operations
Choose a valid construction in the stated order. This exercise organizes dependencies; it does not claim every implementation must evaluate independent branches in this order.
What problem could this relationship represent?
A rate plus a baseline also describes many non-housing relationships.
Context we still need: A model relationship does not prove that changing area causes a price change in the world.
Connect the operations to code
prediction = coefficient * area + baselineRead the code as a map of operations. It is not executed here; imports, shapes and numerical safeguards depend on the actual lesson.
Explain a changed situation
Review the five-level equation-reading journey →
Your notes and reveals are temporary. This reading practice does not change lesson completion or saved assessment evidence.
Finding the line by walking downhill
1 · Observe
Guess, check, nudge
| Word | What it means |
|---|---|
| Loss | One number saying how wrong the model is right now. Here the mean squared error. |
| Gradient | The slope of the loss: it says which way, and how steeply, the loss changes if you nudge a weight. |
| Gradient descent | Repeatedly nudging the weights against the slope so the loss falls. |
| Learning rate (η) | The size of each step. Too small is slow; too big overshoots. |
| Standardise | Rescale a feature to average 0 and spread 1, so one learning rate suits every feature. |
We could solve for the best line with algebra. Most models in this course cannot be solved that way, so we use a method that works everywhere: start with a guess, see which direction lowers the error, step that way, and repeat. This is gradient descent.
2 · Express
The update
For the mean squared error, the slope of the error with respect to each parameter is the average of (prediction − actual) times the input, and for the bias, the average of (prediction − actual). Move each parameter against its slope, scaled by the learning rate η.
3 · Visualize
Five learning rates
Same eight flats, area standardised, starting from w = 0 and b = 0. The best possible MSE is 21.0.
| Learning rate η | After 10 steps | After 200 steps |
|---|---|---|
| 0.01 | 2705.3 | 79.9 |
| 0.1 | 503.8 | 21.0 |
| 0.5 | 21.0 | 21.0 |
| 1.0 | 21.0 | 21.0 |
| 2.1 | 17905.3 | diverged |
A tiny rate is safe but slow: after 200 steps it has not arrived. Rates of 0.5 and 1.0 arrive in about ten steps. At 2.1 each step overshoots the valley by more than it gained, and the error explodes.
- η = 0.01
- η = 0.1
- η = 0.5
See the numbers behind this picture
| Step | η = 0.01 | η = 0.1 | η = 0.5 |
|---|---|---|---|
| 0 | 3,237.625 | 3,237.625 | 3,237.625 |
| 1 | 3,173.613 | 2,626.46 | 825.131 |
| 2 | 3,110.876 | 2,131.416 | 222.007 |
| 3 | 3,049.387 | 1,730.43 | 71.226 |
| 4 | 2,989.121 | 1,405.632 | 33.531 |
| 5 | 2,930.055 | 1,142.545 | 24.107 |
| 6 | 2,872.164 | 929.445 | 21.751 |
| 7 | 2,815.425 | 756.834 | 21.162 |
| 8 | 2,759.815 | 617.019 | 21.015 |
| 9 | 2,705.312 | 503.769 | 20.978 |
| 10 | 2,651.894 | 412.036 | 20.969 |
| 11 | 2,599.538 | 337.733 | 20.967 |
| 12 | 2,548.225 | 277.547 | 20.966 |
| 13 | 2,497.932 | 228.797 | 20.966 |
| 14 | 2,448.641 | 189.309 | 20.966 |
| 15 | 2,400.33 | 157.324 | 20.966 |
| 16 | 2,352.98 | 131.416 | 20.966 |
| 17 | 2,306.573 | 110.43 | 20.966 |
| 18 | 2,261.09 | 93.432 | 20.966 |
| 19 | 2,216.511 | 79.663 | 20.966 |
| 20 | 2,172.82 | 68.511 | 20.966 |
| 21 | 2,129.998 | 59.477 | 20.966 |
| 22 | 2,088.028 | 52.16 | 20.966 |
| 23 | 2,046.894 | 46.233 | 20.966 |
| 24 | 2,006.578 | 41.432 | 20.966 |
| 25 | 1,967.064 | 37.544 | 20.966 |
| 26 | 1,928.337 | 34.394 | 20.966 |
| 27 | 1,890.38 | 31.843 | 20.966 |
| 28 | 1,853.179 | 29.776 | 20.966 |
| 29 | 1,816.718 | 28.102 | 20.966 |
| 30 | 1,780.982 | 26.746 | 20.966 |
| 31 | 1,745.958 | 25.648 | 20.966 |
| 32 | 1,711.631 | 24.758 | 20.966 |
| 33 | 1,677.986 | 24.038 | 20.966 |
| 34 | 1,645.012 | 23.454 | 20.966 |
| 35 | 1,612.693 | 22.981 | 20.966 |
| 36 | 1,581.018 | 22.598 | 20.966 |
| 37 | 1,549.973 | 22.288 | 20.966 |
| 38 | 1,519.545 | 22.037 | 20.966 |
| 39 | 1,489.724 | 21.833 | 20.966 |
4 · Discover
It lands where the algebra does
With η = 0.5 the walk ends at 0.806 × area − 6.82, the same line as the exact solution, after converting from standardised back to raw units. Gradient descent is not a different model. It is a different way to find the same one.
5 · Apply
Two worked examples
Example 1, a step. At w = 0, b = 0 with standardised x, the average of (ŷ − y) is −53.6, the negative of the average price. With η = 0.5 the bias jumps from 0 to 26.8 in one step.
Example 2, a stop rule. Stop when the error barely changes, for example by less than 0.001 between steps, or after a fixed budget. Plot the error against the step number: it should fall smoothly.
6 · Where it goes wrong
Three ways it goes wrong
7 · In Python
Gradient descent in code
Here is how to implement it, step by step. The code below does exactly these steps, and every line is editable.
- Standardise the area, so one learning rate works.
- Start with w = 0 and b = 0, so the model predicts 0 for every flat.
- Compute each flat's miss: prediction minus actual.
- Update w by minus the learning rate times the average of (miss × input), and b by minus the learning rate times the average miss.
- Repeat for many steps while watching the loss fall.
import numpy as np

area = np.array([40, 50, 60, 70, 80, 90, 100, 110], float)
price = np.array([30, 34, 36, 52, 55, 58, 80, 84], float)
w_exact, b_exact = np.polyfit(area, price, 1)

x = (area - area.mean()) / area.std()           # standardise so one learning rate suits both
def run(lr, steps=200):
    w = b = 0.0
    hist = []
    for s in range(steps):
        err = (w * x + b) - price
        w -= lr * (err * x).mean()
        b -= lr * err.mean()
        hist.append(float((err ** 2).mean()))
    return w, b, hist
for lr in [0.01, 0.1, 0.5, 1.0, 2.1]:
    w, b, h = run(lr)
    print("lr", str(lr).ljust(4), "| loss after 10 steps", round(h[9], 1), "| after 200 steps", "diverged" if h[-1] > 1e6 else round(h[-1], 1))
w, b, h = run(0.5)
slope = w / area.std()
intercept = b - w * area.mean() / area.std()
print("gradient descent line: %.3f x area + %.2f" % (slope, intercept), "| exact: %.3f x area + %.2f" % (w_exact, b_exact))
lr 0.01 | loss after 10 steps 2705.3 | after 200 steps 79.9
lr 0.1 | loss after 10 steps 503.8 | after 200 steps 21.0
lr 0.5 | loss after 10 steps 21.0 | after 200 steps 21.0
lr 1.0 | loss after 10 steps 21.0 | after 200 steps 21.0
lr 2.1 | loss after 10 steps 17905.3 | after 200 steps diverged
gradient descent line: 0.806 x area + -6.82 | exact: 0.806 x area + -6.82Edit and run this code in your browser
Live Python
Five learning rates, and the line gradient descent finds
Runs in your browser on your device. Nothing you type is sent anywhere, and nothing here changes your saved progress.
Press Ctrl+Enter (⌘+Enter on Mac) to run. Tab moves focus to the next control, as usual; use spaces to indent.
Want to implement it? Open the step-by-step playbook · How to choose a model
The big idea
Lost on a foggy hill
Imagine standing on a hillside at night, in thick fog. You cannot see the valley, but you can feel the ground tilt under your feet. So you do the only sensible thing: take a small step in the direction that goes downhill, feel the slope again, and repeat.
That is how a machine learns. The hill is the loss: for every possible setting of the line (a slope w and a baseline b), the height tells us how wrong the predictions are. The valley floor is the best line. The slope under your feet is the gradient, which calculus gives us exactly. No machine ever sees the whole hill, only the slope where it stands, and that is enough.
Predict before you read on
Which way is downhill?
Our line starts at w = 10, b = 100. At that spot the slope of the hill is −892.5 in the w direction. It is negative: loss goes down as w goes up. Which step should we take?
Problem and motivation
A training run produces poor estimates. We need a repeatable way to adjust both parameters and diagnose whether learning is working.
Build the intuition
Start with one house: a prediction below its recorded price has a negative residual. An update changes the rule, not the home. Inspect one update in the housing lab before reading the derivative formulas below. Loss is a height on a landscape of parameter settings. A derivative measures the local slope in one parameter direction. The gradient collects these slopes; descent takes a small step downhill.
What you will learn
Connect derivatives to a training decision
- Explain why descent moves opposite the gradient.
- Trace a simultaneous parameter update numerically.
- Diagnose learning-rate instability from a sequence of losses.
- Distinguish optimization evidence from generalization.
Need a quick concept reminder?
Guided experiment
Predict the update direction before pressing Step. Inspect iteration 0 and iteration 1 in the table. Compare the small, moderate and excessive presets from the same initial state. Describe the loss evidence before labelling the run.
Change a lab parameter or inspect another training state or diagnostic scenario, then answer the checks.
Real-world question
How do repeated gradient updates move a prediction line toward the data?
Predict before experimenting
Which learning rate is most likely to overshoot on this dataset?
- Iteration
- 0 0 is the initial state
- Weight
- 10
- Bias
- 100
- MSE
- 20,163.8333
- Weight gradient
- -892.5
- Status
- running
| Iteration | Weight | Bias | MSE | Weight gradient | Bias gradient | Status |
|---|---|---|---|---|---|---|
| 0 | 10 | 100 | 20,163.8333 | -892.5 | -269 | running |
| 1 | 18.925 | 102.69 | 12,413.8473 | -699.1719 | -212.1525 | running |
| 2 | 25.9167 | 104.8115 | 7,652.3527 | -547.6394 | -167.5905 | running |
| 3 | 31.3931 | 106.4874 | 4,726.8912 | -428.867 | -132.6582 | running |
| 4 | 35.6818 | 107.814 | 2,929.4299 | -335.7725 | -105.2737 | running |
| 5 | 39.0395 | 108.8667 | 1,824.9762 | -262.8046 | -83.8053 | running |
| 6 | 41.6676 | 109.7048 | 1,146.2848 | -205.6124 | -66.9742 | running |
| 7 | 43.7237 | 110.3745 | 729.1689 | -160.7854 | -53.7777 | running |
| 8 | 45.3315 | 110.9123 | 472.7575 | -125.6504 | -43.4302 | running |
| 9 | 46.588 | 111.3466 | 315.0784 | -98.1122 | -35.3157 | running |
| 10 | 47.5692 | 111.6998 | 218.0584 | -76.5284 | -28.9516 | running |
| 11 | 48.3344 | 111.9893 | 158.306 | -59.6119 | -23.9595 | running |
| 12 | 48.9306 | 112.2289 | 121.4507 | -46.3535 | -20.0427 | running |
| 13 | 49.3941 | 112.4293 | 98.6635 | -35.9626 | -16.9687 | running |
| 14 | 49.7537 | 112.599 | 84.5201 | -27.8191 | -14.5555 | running |
| 15 | 50.0319 | 112.7446 | 75.6881 | -21.4372 | -12.6602 | running |
| 16 | 50.2463 | 112.8712 | 70.1201 | -16.4362 | -11.1708 | running |
| 17 | 50.4106 | 112.9829 | 66.5582 | -12.5173 | -9.9995 | running |
| 18 | 50.5358 | 113.0829 | 64.2297 | -9.4468 | -9.0777 | running |
| 19 | 50.6303 | 113.1736 | 62.6598 | -7.0412 | -8.3514 | running |
| 20 | 50.7007 | 113.2572 | 61.5569 | -5.1568 | -7.7783 | completed |
Explain the observation
Describe only what the trace demonstrates.
Loss decreased across the inspected states, which shows optimization progress. This short trace alone does not establish convergence or generalization.
Each point is a complete parameter state. Iteration 0 is before any update; iteration 0 is after 0 successful updates.
Apply it
Compare small, moderate, and excessive rates.
Run each preset from iteration 0. Find one smooth decrease and one sequence that increases, oscillates, or terminates. Use the loss chart and runtime status as evidence.
Mathematical reasoning
L = (1/m) Σ rᵢ² is mean squared error over m observations, with rᵢ = ŷᵢ − yᵢ. Squaring stops positive and negative errors cancelling, and emphasizes large misses. A loss function turns many prediction errors into one optimization target.
For one feature, ∂L/∂w = (2/m) Σ rᵢxᵢ and ∂L/∂b = (2/m) Σ rᵢ. The chain rule supplies the feature factor for the weight derivative; the derivative of a prediction with respect to bias is 1. Gradients describe sensitivity of the entire dataset loss, not one selected residual.
A positive derivative means increasing that parameter locally increases loss. The gradient points in the direction of steepest local increase under the usual Euclidean distance. Hence w_new = w − α∂L/∂w and b_new = b − α∂L/∂b. Both derivatives must be computed from the same pre-update state. A negative derivative makes the subtraction increase the parameter.
Separate small-number worked example (not the housing lab settings): for inputs [1,2], targets [3,5], w = 1, b = 0: predictions [1,2], residuals [−2,−3], weight gradient −8, bias gradient −5. With learning rate α = 0.1 the next state is w = 1.8, b = 0.5. The runtime computes the exercise answer from this training trace.
Learning rate multiplies the update, not the gradient itself. A small rate can make slow progress; a large rate can overshoot, oscillate, increase loss, or eventually produce numerical divergence. A single increase is not proof of divergence. For this convex squared-error linear model an appropriate step can approach a minimum, but a short decreasing trace does not prove convergence or useful unseen predictions. Compare changes over many iterations, finite gradients and held-out error. Differently scaled features can make one shared rate awkward.
Mathematical symbol key
L, m, Σ, i- Dataset loss, observation count, sum, and observation index
rᵢ, xᵢ, yᵢ, ŷᵢ- Residual, input, observed and predicted target for row i
∂, ∇L- Partial derivative operator and vector of loss derivatives
w, b, α- Weight, bias and positive learning rate
new- Parameter after one simultaneous update
Real-world application
An energy-demand training job shows exploding loss after a rate change. Reduce the rate, inspect feature scales fitted on training data, and check finite updates. Select model settings using validation data; reserve test data for final evaluation.
Guided exercises and misconception checks
Explain the consequence of a change or choose a defensible action. Each check can be retried after the worked feedback. Successful checks remain recorded when you return.
Now you drive
Code gradient descent yourself
The lab above ran the algorithm for you. Now write its heart: three lines of Python. The equations from this lesson become code almost word for word:
| Maths | Python | In plain words |
|---|---|---|
| rᵢ = ŷᵢ − yᵢ | r = predict(w, b, xi) - yi | How wrong is row i? (prediction minus actual) |
| ∂L/∂w = (2/m) Σ rᵢ xᵢ | dw += 2 / m * r * xi | The Σ is the loop; each row adds its share. Steeper where the input xᵢ is large. |
| ∂L/∂b = (2/m) Σ rᵢ | db += 2 / m * r | Same, without xᵢ: the baseline multiplies 1. |
| w ← w − α ∂L/∂w | w = w - lr * dw | Step against the slope. α is lr, the size of the step. |
Fill in TODO 1, TODO 2 and TODO 3, then press Check my code. Before you finish, the program already runs; with the TODOs empty, the line just never moves. Notice what the loss curve does.
Live Python
Gradient descent on the housing data
Runs in your browser on your device. Nothing you type is sent anywhere, and nothing here changes your saved progress.
Press Ctrl+Enter (⌘+Enter on Mac) to run. Tab moves focus to the next control, as usual; use spaces to indent.
Stuck? Show a worked solution (try first!)
# ── Settings you can change ────────────────────────────
lr = 0.01            # learning rate: how big each downhill step is
steps = 20           # how many steps to take
w0, b0 = 10.0, 100.0 # starting guess:  price = w × area + b

# ── The data: area (thousand ft²) → price (₹ lakh) ──
X = [1.0, 1.8, 2.5, 3.2, 4.0, 4.8]
y = [178, 213, 246, 278, 316, 349]
m = len(X)

def predict(w, b, x):
    return w * x + b

def loss(w, b):
    # mean squared error: the height of the hill at (w, b)
    return sum((predict(w, b, xi) - yi) ** 2 for xi, yi in zip(X, y)) / m

def gradients(w, b):
    dw, db = 0.0, 0.0
    for xi, yi in zip(X, y):
        r = predict(w, b, xi) - yi    # residual: prediction − actual
        dw += 2 / m * r * xi              # (2/m) · rᵢ · xᵢ
        db += 2 / m * r                   # (2/m) · rᵢ
    return dw, db

w, b = w0, b0
history = [loss(w, b)]                # loss before any step
for step in range(steps):
    dw, db = gradients(w, b)
    w = w - lr * dw                   # w ← w − α · ∂L/∂w
    b = b - lr * db                   # b ← b − α · ∂L/∂b
    history.append(loss(w, b))

print(f"start:  w = {w0:.2f}   b = {b0:.2f}   loss = {history[0]:.1f}")
print(f"after {steps} steps:  w = {w:.2f}   b = {b:.2f}   loss = {history[-1]:.1f}")
Experiment, then explain
Finish the three TODOs, then use the quick experiments (or edit lr and steps yourself). Think about each question before opening its answer.
With lr = 0.001 the loss barely moves. Is the code broken?
No. The same correct code takes tiny steps, so after 20 of them the loss has only fallen from 20,164 to about 8,451 and w is still near 25. Try steps = 500: small steps are safe, just slow.
At lr = 0.05 the loss drops from 20,164 to about 198 in one step. Why does lr = 0.1 blow up?
At 0.05 the first step already overshoots the valley floor (the slope flips from negative to positive), but each later step lands closer. At 0.1 every overshoot is bigger than the last, so the loss grows instead of shrinking: after 20 steps it is about 8 million. The step size has to be small enough for each correction to shrink the error.
Why is the slope for b (−269) smaller than for w (−892.5)?
Each row’s share of ∂L/∂w is multiplied by its area xᵢ (up to 4.8), but ∂L/∂b is multiplied by 1. A feature measured in larger numbers has a steeper slope, which is why the next lessons talk about scaling features.
Same numbers, two ways: at lr = 0.01, 20 steps, this code ends at w ≈ 50.70, b ≈ 113.26, loss ≈ 61.6, exactly the iteration-20 row of the guided lab above, which runs on the platform’s verified TypeScript maths runtime.
Build the evidence
0 of 4 checks complete. Experiment interaction still required.
Completion records these objectives locally; it does not award mastery. Independent mastery will require unfamiliar examples and critical-objective evidence in the later assessment.
Explore the book’s separate housing example
Move the settings toward smaller error
For observations (1,2), (2,3), (3,5), a least-squares line has slope 1.5 and intercept 1/3. A formula and an iterative search can solve the same objective under suitable conditions.
The playground uses a separate dataset. Compare with the illustrated example ↓
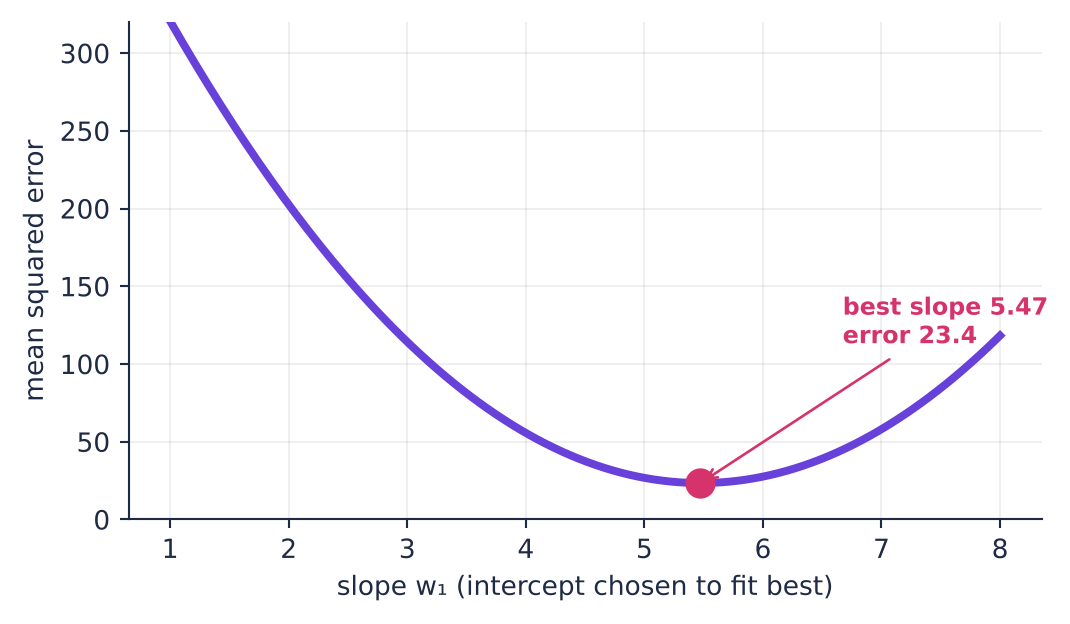
Source: Linear Regression · Book 8, PDF pages 8–10. Static source illustration; annotated scores belong to this example.
| Method | What it does |
|---|---|
| Least squares | Solve the linear fit numerically |
| Gradient descent | Repeat local updates |
| Validation | Check usefulness on unseen cases |
w_new = w_old − learning_rate × loss_gradient
A gradient is a local sensitivity. Subtracting it proposes a downhill step; the learning rate scales that step.
Return to the playground and explain how its inputs connect to this relationship. Unscored reading.